
Your monthly marketing report is probably full of good news. Impressions up. Clicks up. A tidy arrow pointing north on nearly every chart. It feels like progress.
It also tells you almost nothing about whether marketing made you any money.
That is the quiet problem sitting inside most B2B (business to business) reports. The numbers that are easiest to show tend to be the numbers that matter least, while the question every owner actually asks (is this spend paying for itself?) gets buried near the bottom or skipped altogether. This piece is about how to read your report honestly, and what a good one should be putting in front of you.
Key Insights
- Vanity metrics dominate most reports. Impressions, clicks, likes, reach and follower counts measure activity, not money. They climb whether or not a single new customer walks through the door.
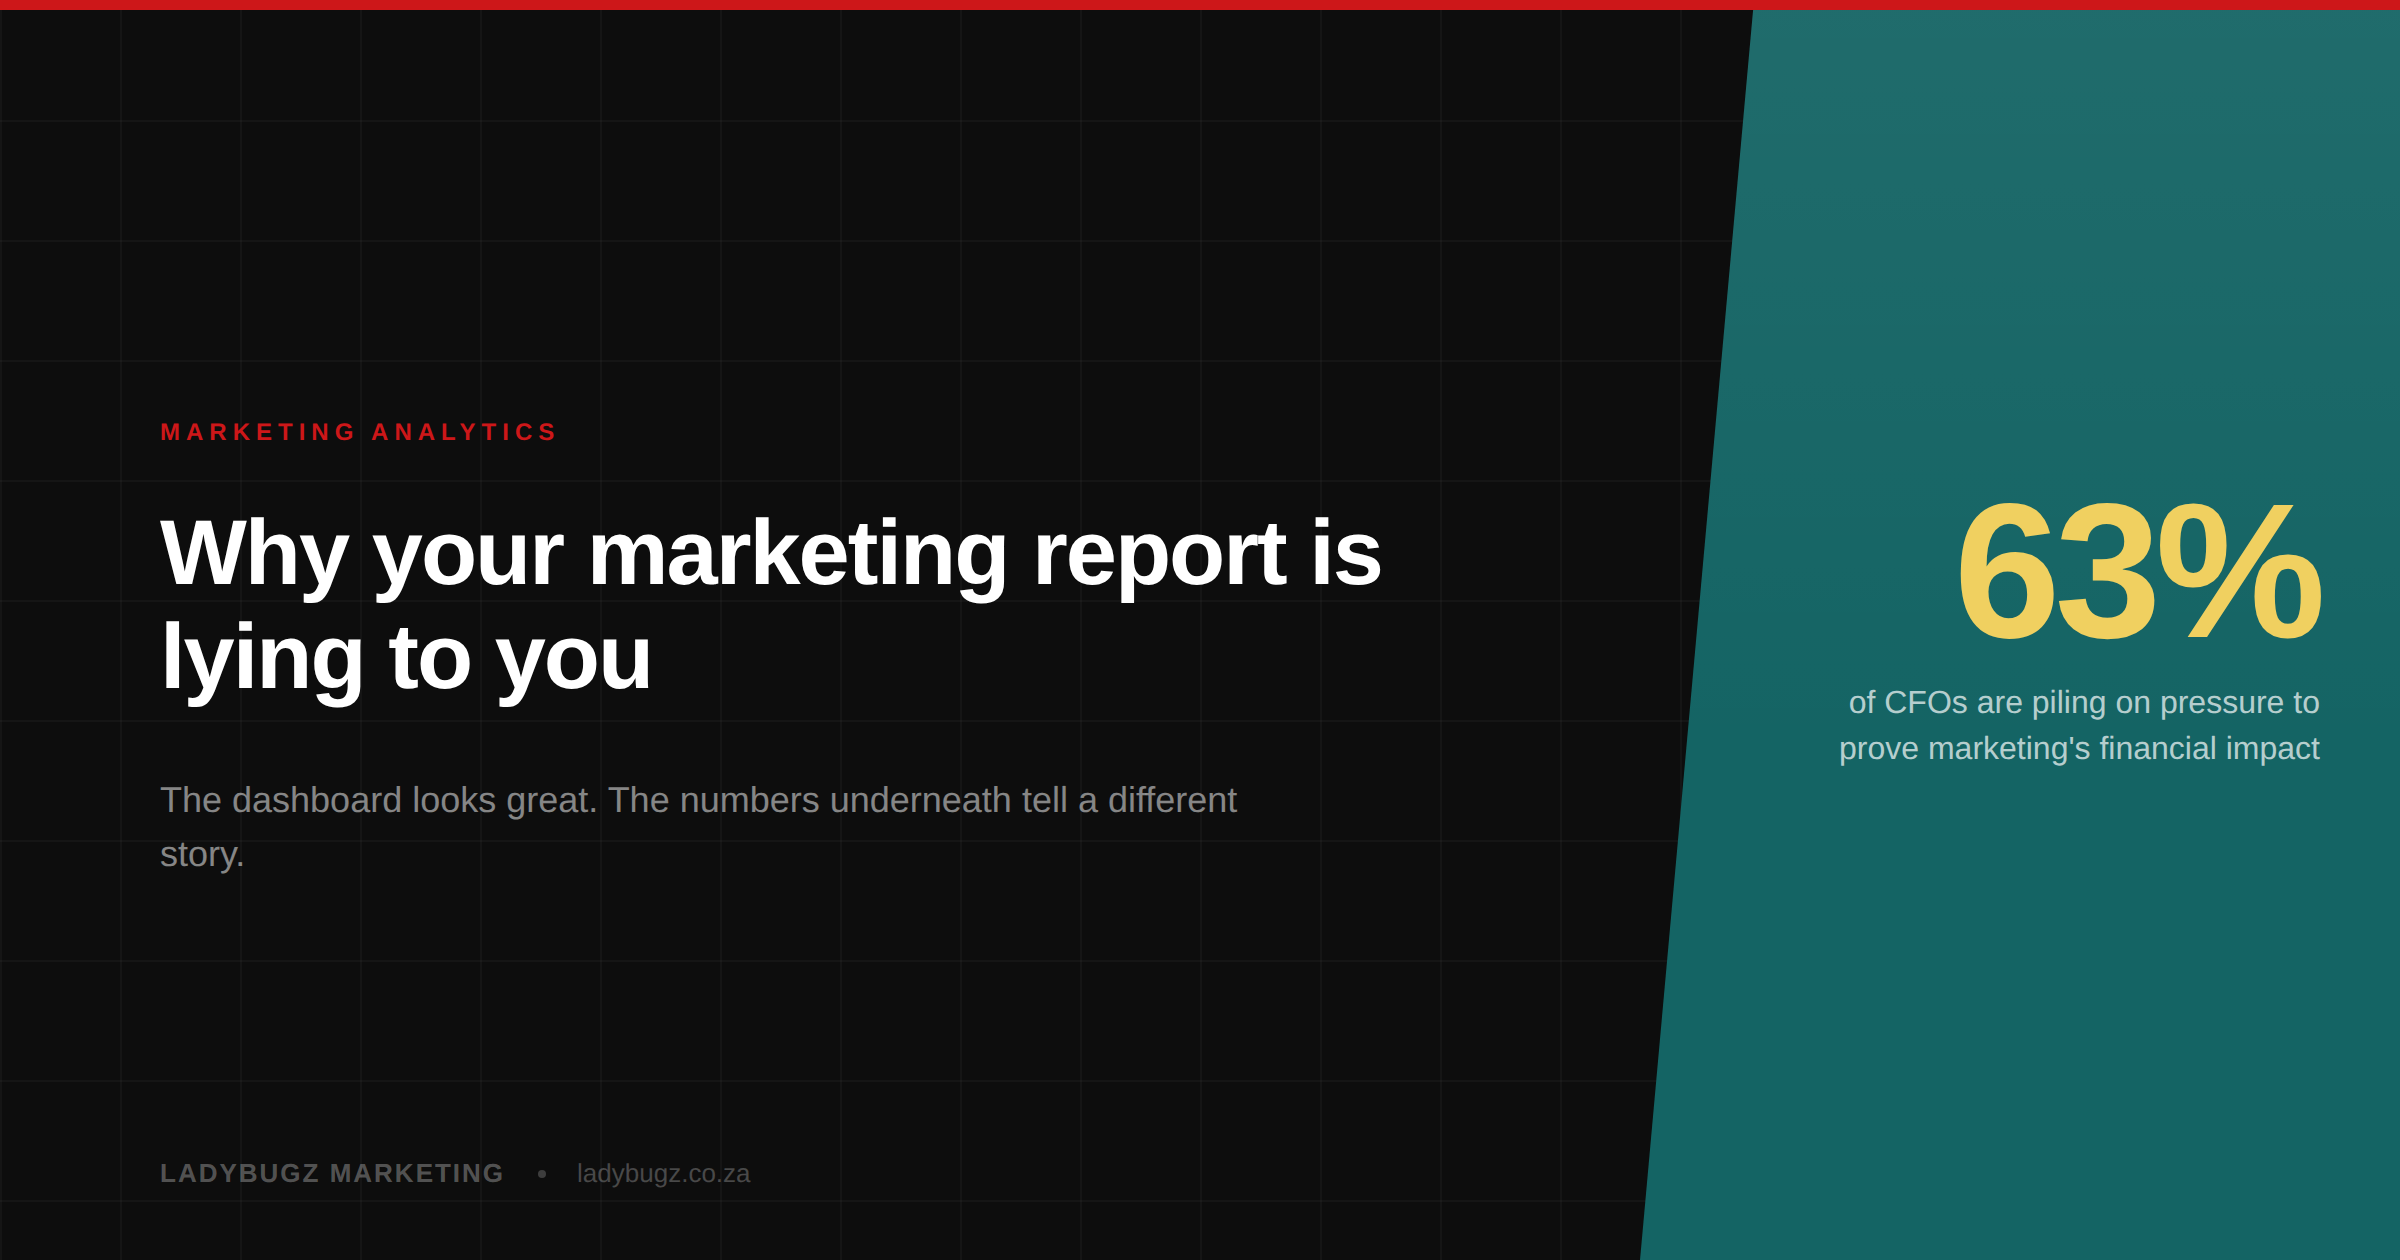
- The pressure to prove profit is real, and rising. The CMO Survey (April 2025) found marketing leaders name demonstrating financial impact as their top challenge, with 63% reporting increased pressure from CFOs, up from 52%.
- Profit metrics tell the truth. CAC (cost to acquire a customer), LTV (lifetime value), the LTV:CAC ratio and margin all reveal whether marketing is genuinely working.
- There is a benchmark to aim for. The widely used rule popularised by David Skok says a healthy business earns back at least three times what it spends to win a customer, and recovers that cost within a handful of months.
- A good report drives decisions. If your report cannot tell you where to move budget or what to stop, it is decoration, not management information.
What is a vanity metric, and why does it feel so good?
A vanity metric is a number that looks impressive but does not connect to revenue or profit. Impressions, clicks, likes, reach and follower counts all sit in this bucket.
Each one measures activity. Your post was shown 40,000 times. Your ad was clicked 900 times. Your follower count ticked up by a few hundred. None of that tells you a customer arrived, signed, or paid you a cent.
They feel good for a simple reason. They almost always go up. Post more and impressions rise. Spend more and clicks rise. A number that only ever climbs tracks your effort, not your results.
Why are marketing reports full of these numbers?
Because they are easy to pull, and they look busy. Every platform hands these numbers to you for free, pre-packaged in a dashboard, so they land in the report by default.
There is a second reason, and it is less comfortable. Activity numbers let everyone avoid the harder conversation about profit. A slide of impressions never has to admit that the quarter cost more than it brought in.
That evasion is getting harder to sustain. The CMO Survey, run out of Duke University’s Fuqua School of Business, found that marketing leaders name demonstrating impact on financial outcomes as their single biggest challenge, and the scrutiny is climbing: 63% report increased pressure from CFOs (up from 52%), 61% face greater scrutiny from CEOs, and 50% from board members. A wall of activity leaves you exposed the moment a finance-minded person asks the obvious question.
What should your marketing report actually tell you?
Four numbers, and they are all about money. Here is each one in plain terms.
CAC, or cost to acquire a customer. This is what it costs you, on average, to win one new customer. Add up everything you spent on sales and marketing over a period, then divide by the number of new customers you won. Spend R100,000 and win 20 customers, and your CAC is R5,000. It is the price tag on growth.
LTV, or lifetime value. This is the total profit a customer brings you over the whole time they stay with you, not just their first order. A client worth R8,000 a year who stays four years is worth far more than one who buys once and leaves.
The LTV:CAC ratio. This is what a customer is worth divided by what they cost to win. If a customer is worth R30,000 over their lifetime and costs R5,000 to acquire, the ratio is 6 to 1. Drop below 1 and you are losing money on every customer, and more marketing only digs the hole faster. The benchmark popularised by investor and entrepreneur David Skok is that the strongest businesses run a ratio higher than 3, sometimes as high as 7 or 8. That rule comes from the software world, so treat it as a guide rather than a law, but the principle holds anywhere: a customer should be worth several times what you pay to win them.
Margin and payback period. Margin is the profit left after your costs are covered, so it separates revenue that looks big from revenue that actually feeds the business. Payback period is how many months it takes to earn back that CAC. Skok notes the best software operators recover it in about 5 to 7 months. The sooner your money comes back, the less risk you carry and the faster you can reinvest.
Activity is not the same as business value
This is worth saying plainly, because it is the trap most reports fall into. LinkedIn’s own B2B Institute, drawing on the research of Les Binet and Peter Field, makes the point directly: short-term activation metrics are not the same as long-term business value. As they put it, “Activation marketing can’t build a brand for you, no matter how much you spend on it.”
The clicks and impressions might capture demand that already exists this month. They do not tell you whether you are building something worth more next year. A report that only counts activity is measuring the short game and calling it the whole match.
How do you know if your marketing is genuinely working?
A good report changes what you do next. That is the real test. It should point clearly to a decision: move budget from a channel that is not paying back into one that is, reprice an offer whose CAC is too high, or drop an activity that quietly loses money every month.
Activity metrics cannot do that. Knowing your reach rose 12% does not tell you where to spend your next rand. Knowing that one channel wins customers at R2,000 and another at R9,000 tells you exactly where to spend it.
In most audits we run, the report opens with reach and closes without a single line on what a customer costs or what one is worth. The team is working hard and reporting diligently. They are just reporting the wrong things, and no one has asked them to change. Once the profit numbers go in, the arguments about budget tend to settle themselves, because the evidence is finally on the table.
Where should you start?
Ask for the right numbers. Tell your marketing team or agency you want CAC, LTV and margin reported alongside the reach and click figures, not instead of them. The activity numbers still help you spot trends. They just cannot sit at the top of the page pretending to be results.
Then get an honest outside read. It is hard to audit your own reporting, because the people who built it are close to it and invested in it. A structured marketing audit looks at what you measure, whether the data behind it can be trusted, and whether your reporting connects to profit at all. You can see the difference it makes in our client case studies.
Your report should be the most useful document you read all month. If it makes you feel good but leaves you no wiser about where your money went, it is not a report. It is a comfort blanket with a logo on it.
Ready to find out what your current reporting is quietly hiding? Our B2B Marketing Strategy Audit is R995 and expert-reviewed.
Editorial note: figures are cited inline from the named sources where they appear. The LTV:CAC benchmark originates in software businesses and is offered as a widely used guide, not a fixed rule.